
Rupert Murdoch, un caso de estudio en TwitterRupert Murdoch, a case study on Twitter
Actualización 10-ene-2011: motorización parada a las 15:30 del 10-ene-2012 porque el crecimiento de seguidores se ha normalizado. Hacia tiempo que quería visualizar dinámicamente los experimentos y gracias a que Alfonso Romay me sugirió lo siguiente en Twitter me he decidido a dar ese paso:
@congosto ¿Merece la pena hacer un análisis comparativo de crecimiento rápido en cuentas de Twitter? La de @rupertmurdoch es espectacular.
— Alfonso Romay (@AlfonsoRomay) January 2, 2012
El resultado es la monitorización del crecimiento de seguidores de Rupert Murdoch en Twitter que se actualiza cada 5 minutos.
- La primera gráfica muestra el acumulado de seguidores diarios hasta el momento actual
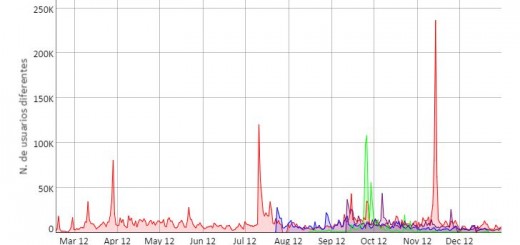
- la segunda muestra los seguidores por unidad de tiempo. El grano más pequeño es el minuto y es posible hacer zoon temporal de 1 minuto a un año. pasando el ratón por la gráfica se muestra en la esquina superior derecha el número de seguidores con la fecha y hora
Ambas visualizaciones están realizadas con el API de visualización de google. Nota: el día 3-01-2012 de 20 a 22 no existe medida por unidad de tiempo debido a un error mío copiando archivos.
Updated 2011-01-10 : experiment stopped on 2012-01-10 at 15:30, due to low growth of followers For a while now I have been thinking about displaying experiments dynamically. Thanks to a suggestion from Alfonso Romay on Twitter, I decided to take that step:
@congosto ¿Merece la pena hacer un análisis comparativo de crecimiento rápido en cuentas de Twitter? La de @rupertmurdoch es espectacular.
— Alfonso Romay (@AlfonsoRomay) January 2, 2012
The result has been some interactive graphs to show Rupert Murdoch’s followers growth on Twitter every five minutes
- The first graph shows the cumulative followers to the present time
- The second shows the followers per unit of time. The smaller unit is a minute. The graph allows a zoom from 1 minute to a year. If you move your mouse over, the number of followers with the date and time shown in the upper right corner
Both graphs are made with Google visualization API. Note: On January 3, from 20 to 22 there isn’t any measure by time unit due to a mistake copying files.


1 respuesta
[…] « Rupert Murdoch, un caso de estudio en Twitter Experimentos, Twitter, […]