El hashtag #ZapataDimisión en 360º360º about the hashtag #ZapataDimisión
Hace una semana Antonio Delgado me propuso escribir sobre el hashtag #ZapataDimisión pero en ese momento tenía que dar prioridad a la revisión de un artículo vital para mi tesis y lo dejé aparcado. He sacado un pequeño hueco para poder elaborar los datos y obtener conclusiones sobre este caso que marcará un antes y un después en el uso de las redes sociales.
Últimamente Twitter se está convirtiendo en un campo de batalla en el que los usuarios se polarizan ante cualquier suceso. Cuando una polémica llega a ser TT(Trending Topic) alcanza una visibilidad general más allá de timeline, traspasando algunas veces los límites de Twitter para colarse como noticia en los medios tradicionales. Por ese motivo los TT tienen un enorme potencial divulgador y siempre nos preguntamos hasta que punto son espontáneos o manipulados.
Los TT se podrían comparar a un incendio en el que se desconoce si ha sido natural o provocado hasta que se analizan los puntos desde los que se originó y los factores que favorecieron su propagación. De la misma manera vamos a abordar el análisis del TT #ZapataDimision, analizando el origen del hashtag, su primeras propagaciones, cómo se fue extendiendo, cuales fueron los altavoces de la propagación y cuál fue el papel de los medios.
Origen y propagación
El primer tuit que se detectó con el hashtag #zapatadimision fue el de José Luis Vázquez a las 17:17 del día 13 de junio.
@casiopeaexpres Es inadmisible que alguien como usted represente siquiera a una hormiga. @AhoraMadrid #zapatadimisión
— José Luis Vázquez (@jlvazmar) June 13, 2015
Este hashtag fue utilizando desde su inicio en distintas modalidades, con mayúsculas y minúsculas y con acento o sin él. Esto denota espontaneidad en el origen y que no fue una campaña organizada. Además, el crecimiento fue orgánico, no obedeció a ninguna sincronización. La propagación empezó a aumentar cuando intervinieron usuarios con muchos seguidores realizando RTs o publicando tuits, entre ellos @hermanntertsch (19:01, 19:23, 22:10, 22:11, 22:44, 22:45), @pedroj_ramirez (20:25, día 14 0:16), @DavidSummersHG (20:53), @mrm8488 (22:13), @kastillo62 (23:10), @alfonso_ussia (23:23), @isanseba (23:31, 23:53, día 14 0:50, 0:51, 1:02, 1:21), @hugokeppler (23:40, día 14 0:40), @oneto_p (23:54), @JesusEncinar (día 14 0:57), @josecdiez (día 14 1:00), @JuanfraEscudero (1:14), @CubaSinFrontera (día 14 2:23). A las 00:02:12 del día 14 de junio fue 5º TT en Madrid.
El día 14 a las 8 de la mañana se reactivó, siendo los usuarios que pudieron contribuir a su difusión mediante RTs o tuits: @josecdiez (9:07, 10:39, 11:18), @hermanntertsch (9:21, 9:55, 9:58), @pedroj_ramirez (9:22, 9:23, 9:38), @JesusEncinar (10:30, 10:40), @martinvars(10:32, 10:43), @fredhermel (10:47), @jatirado (10:53, 10:55, 10:58). A las 10:16 empezó a ser TT en España en el puesto 6º llegando a ser el primero a las 11:47.
La siguiente imagen interactiva contrasta la propagación global con la propagación polarizada. Para determinar la polaridad de los usuarios que participaron se utilizó la relación de RT. Los usuarios tienden a hacer RT de los mensajes con los que están de acuerdo, esto produce que unos usuarios estén más relacionados entre sí que otros y se formen comunidades. Por este método (ver metodología en el pie del post) se clasificaron a los usuarios como anti-Zapata y pro-Zapata y se segregaron sus tuits en dos conjuntos separados para ver su evolución en el tiempo. Estos dos grupos representan el 94,74% del total de los tuits, el 5,26% restante corresponde a los usuarios inciertos (hicieron RT de distinta polaridad) y a los que no hicieron RT. La fiabilidad de esta clasificación se comprobó manualmente con una muestra aleatoria de 300 tuits en cada uno de los datasets. Para los tuits anti-Zapata la fiabilidad fue del 94,33% y para los pro-Zapata del 92%.
Podemos apreciar cómo el crecimiento de los tuits fue orgánico, creciendo la difusión en pequeños saltos posiblemente inducidos por usuarios con muchos seguidores que hicieron RT o tuitearon. El día 13 prácticamente se propagaron tuits anti-Zapata (las gráfica de tuits globales y anti-zapata se solapan). Los tuits pro-Zapata aparecieron el día 14 en el momento que fue TT en España. Salvo a las 18:00 los tuits contrarios superaron a los tweets favorables a Zapata. Podemos deducir que tuvo un origen espontáneo y que la propagación fue favorecida por usuarios con muchos seguidores de tendencia política liberal-conservadora o simpatizantes con la comunidad judía.
¿Mucho ruido y pocas nueces?
Una manera de comprender la verdadera dimensión de un TT es evaluar cuantos tuits fueron originales, cuantos fueron RTs y cuál fue la distribución de RTs por usuario. La participación en las redes sigue una distribución de la Ley de potencias en la que una minoría es el origen de la mayoría de la información que circula. A grandes rasgos podemos identificar a la masa crítica que originó la mayoría de los mensajes.
Los datos no son sorprendentes, suelen ser casi siempre de esta manera. De 130.954 tuits globales, 104.580 fueron RTs (79,86%), por lo tanto, solo un 20,14% fue información original. De los 80.867 tuits anti-Zapata, 65.527 fueron RTs (81,03%), siendo original el 18,97%.
Para ver la distribución de los RTs se clasificaron los usuarios anti-Zapata en función de su actividad (el detalle de la clasificación en la metodología) y se encontró que los altavoces, 508 usuarios, recibieron 52.415 RTs, es decir, el 2,65% de los usuarios obtuvieron el 79,99% de los RTs contrarios a Zapata.
En la siguiente gráfica interactiva se puede ver la clasificación de usuarios anti-Zapata en función del impacto de sus tuits. Pulsando en cada grupo aparece en la zona inferior los usuarios del grupo ordenados en función del número de RTs recibidos.

De la misma manera también podemos ver en la siguiente gráfica interactiva la actividad de los usuarios anti-Zapata para hacer RT. Encontramos que 2.830 usuarios realizaron 37.641 RTs, es decir, que el 14,74% de los usuarios realizaron el 57,44% de los RTs.
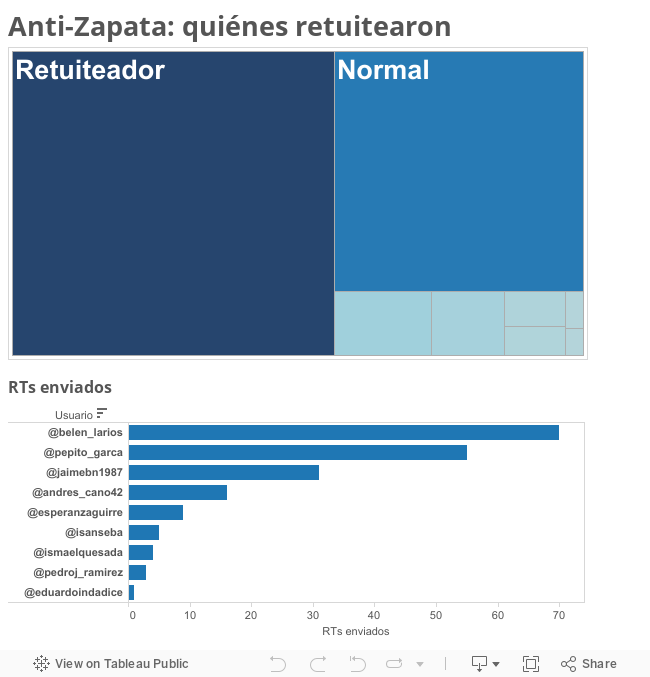
El núcleo duro de los que movieron los tuits no llegó a 3.500 usuarios. Podemos concluir que hubo más ruido que nueces.
El papel de los altavoces y los medios de comunicación
Para ver cómo los altavoces y los medios de comunicación influyeron en la propagación hemos creado tres gráficas alineadas temporalmente. La primera corresponde a la evolución por hora de los tuits totales, anti-Zapata y pro-zapata. La segunda, muestra a la difusión de los veinte tuits más difundidos, tanto anti-Zapata como pro-Zapata (se ha utilizado un código de color para agruparlos: azul los anti-Zapata, morado los pro-Zapata y verde los neutrales. Pasando el ratón por la gráfica aparece el texto del tuit y el número de RTs que tuvo en esa hora). La tercera gráfica representa la propagación de los tuits de los medios y de los periodistas.
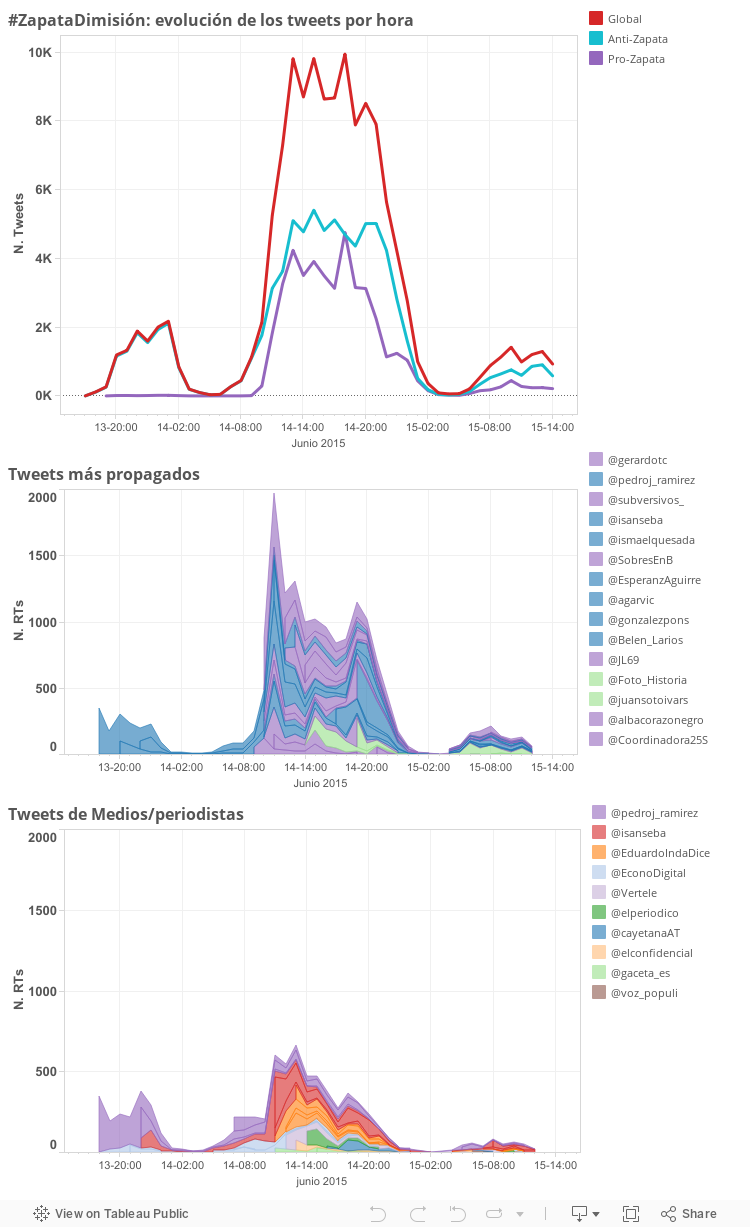
Durante el día 13 se observa que el patrón de difusión de las gráficas segunda y tercera condicen debido a que los mensajes de @pedroj_ramirez e @isanseba estaban casi todos en el top 20 y no hubo otros periodistas que publicaran tuits. El día 14, el perfil de propagación de los periodistas pierde peso frente a nuevos altavoces tanto anti-Zapata como pro-Zapata.
Se podría concluir que los mensajes de @pedroj_ramirez e @isanseba ayudaron a la creación del TT del día 13 pero en del día 14 intervinieron además otro tipo de altavoces.
¿A favor o en contra de Zapata?
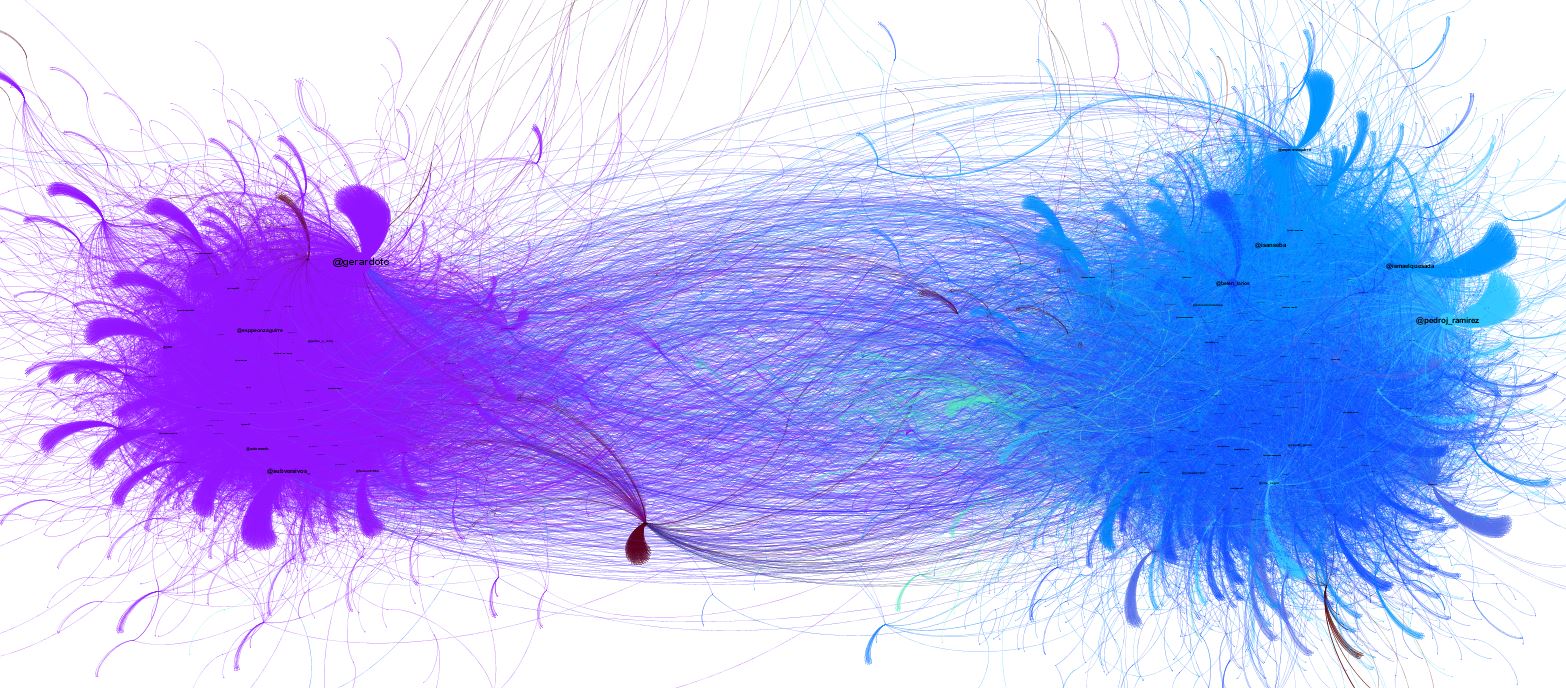
La polarización de los usuarios queda reflejada en este grafo de RTs. A la izquierda, en una única comunidad, se encuentran los que apoyaron a Zapata y a la derecha los que le atacaron, formados por varios grupos: simpatizantes con la comunidad judía y personas de ideología liberal-conservadora.
(Pulsar en la imagen para verla a un tamaño mayor)
Metodología
- Los datos se obtuvieron con la API REST de Twitter, método search, solicitando los tuits que contuvieran los hashtags «#ZapataDimision OR #dimisióndeZapataySoto»
- Se capturaron 130.954 tuits de 37.979 usuarios diferentes desde 2015-06-13 17:17:37 hasta 2015-06-15 14:39:09
- Para determinar la polaridad de los usuarios no se ha recurrido al análisis semántico de los tuits (no soy experta en esta tecnología) en su lugar que se ha utilizado la relación de RT. Los usuarios tienden a hacer RT de los mensajes con los que están de acuerdo, esto produce que unos usuarios estén más relacionados entre sí que otros y se que se formen comunidades. La polaridad se ha obtenido del grafo de RTs procesado con Gephi. Se detectaron varias comunidades cuyos usuarios se clasificaron en: anti-Zapata (19.205 usuarios), pro-Zapata (13.782 usuarios) e inciertos que hicieron RT de distinta polaridad (1.378 usuarios)
- Una vez identificados los usuarios anti o pro Zapata, se segregaron sus tuits a fin de poder analizarlos por separado. Se clasificaron 80.867 como anti-zapata (61,75%), 43.193 tweets pro-zapata (32,98%) y un 5,26% sin clasificar por ser inciertos o por no haber hecho RT. La fiabilidad de esta clasificación se comprobó manualmente con una muestra aleatoria de 300 tuits en cada uno de los datasets. Para los tuits anti-Zapata la fiabilidad fue del 94,33% y para los pro-Zapata del 92%
- Se clasificaron los usuarios anti-Zapata según su actividad e impacto en estas categorías
- Altavoz: cuando el número de RTs recibidos fue cuatro veces mayor que el volumen de tuits emitidos. Hay tres grupos: el altavoz alto formado por los usuarios con más impacto que acapararon el 20% de los RTs, los altavoces medios son los siguientes usuarios más retuiteados que obtuvieron un 30% de los RTs y los altavoces bajos el resto
- Networker: con actividad alta, un número de RTs recibidos superior a la media, y el número de tuis publicados-recibidos está balanceado
- Retuiteador: con actividad alta y con más RTs que tweets propios
- Replicador: la mayoría de sus tuits son replies. Al no aparecer los replies en los timelines, no suelen recibir RTs
- Monologista: actividad por encima de la media y el número de RTs recibidos bajo
- Normal: resto de los usuarios que no cumplen estos patrones de comportamiento específicos
- Se analizó la propagación de los 20 tuits más difundidos y los tuits de los medios y periodistas para ver en qué manera favorecieron la propagación general
- La visualización del grafo de RTs se realizó con Gephi
A week ago Antonio Delgado suggested I write about the hashtag #ZapataDimisión but I was too busy reviewing a vital paper for my thesis. I collected the data but I had to postpose the analysis until right now. #ZapataDimisión’s case could mark a before and after in the use of social media in Spain.
Lately Twitter is becoming a battlefield in which users are polarized for any event. When a controversy becomes TT (Trending Topic) it attains a general visibility beyond the timeline, sometimes going outside of Twitter as a news item on traditional media. For this reason TT´s have an enormous spread potential and we always ask ourselves if it was spontaneous or manipulated.
TT´s could be compared to a fire whose cause is unknown natural or arson until it is analysed the origin and the factors that favoured its spread. In the same way we were analysing the TT #ZapataDimision, looking into the hashtag´s origin, the first propagations, how it spread, who were the most spread users and what was the role of the media.
Origin and spread
The first tweet was detected with the hashtag #zapatadimision was published by José Luis Vázquez at 17:17 on 13 June.
@casiopeaexpres Es inadmisible que alguien como usted represente siquiera a una hormiga. @AhoraMadrid #zapatadimisión
— José Luis Vázquez (@jlvazmar) June 13, 2015
This hashtag was used since its beginning in various forms, including uppercase and lowercase accented or not. This denotes spontaneity in origin and that it was not an organized campaign. In addition, growth was organic, not due to synchronization. The spread began to rise when some users with many followers retweeted or posted tweets, like these: hermanntertsch (19:01, 19:23, 22:10, 22:11, 22:44, 22:45),pedroj_ramirez ( 20:25 14th 0:16),DavidSummersHG (20:53), @ mrm8488 (22:13), @ kastillo62 (23:10),alfonso_ussia (23:23),isanseba (23:31, 23:53, 14th 0:50, 0:51, 1:02, 1:21),hugokeppler (23:40, 14th 0:40),oneto_p (23:54),JesusEncinar (day 14 0:57),josecdiez (14th 1:00 am),JuanfraEscudero (1:14),CubaSinFrontera (14th 2:23). At 00:02:12 on 14 June was 5th TT in Madrid.
The 14th at 8am was reactivated, these users could contribute to its spread through RTs or tweets: josecdiez (9:07, 10:39, 11:18),hermanntertsch (9:21, 9 : 55, 9:58),pedroj_ramirez (9:22, 9:23, 9:38),JesusEncinar (10:30, 10:40),martinvars (10:32, 10:43),fredhermel (10:47),jatirado (10:53, 10:55, 10:58). At 10:16 it started to be TT in Spain in the 6th, becoming the first at 11:47.
The following interactive image contrasts the global spread with polarized propagation. RT relation was used to determine the polarity of the users who participated. Users tend to retweet if they agree, this causes some users are more interrelated than others and forming communities. By this method (see methodology at the foot of the post) the users were classified as pro-Zapata and anti-Zapata and their tweets are segregated into two separate datasets to see their evolution in time. These two groups published the 94.74% of the tweets, the remaining 5.26% were uncertain users (retweeted to both polarities) and people did not retweet. The accuracy of this classification was manually checked over a random sample of 300 tweets in each datasets. For anti-Zapata tweets precision was 94.33% and for the pro-Zapata 92%.
We can see how tweet growth was organic, rising diffusion in small jumps possibly induced by users with many followers who retweeted or tweeted. On 13th of June the anti-Zapata users were a majority (the line of global and anti-Zapata tweets overlap). On 14th June pro-Zapata tweets appeared when it became TT in Spain. Except at 18:00 anti-Zapata tweets were more than pro-Zapata tweets.
We can deduce that the origin was spontaneous and the spread was favoured by users with many followers with liberal-conservative political tendency or sympathizers with the Jewish community.
Much ado About Nothing?
One way to understand the true dimension of a TT is measuring how many tweets were original or RTs and what the distribution of RTs per user was. Participation on social media follows a power law distribution in which a minority is the source of most of the information spread. Broadly we can identify the critical mass that caused most of the messages.
The result did not surprise us; it is similar to other cases. From 130,954 global tweets, 104,580 were RT’s (79.86%), so only 20.14% was original information. From 80,867 anti-Zapata tweets, 65,527 (81.03%) were RT’s, hence 18.97% was original tweets
To know the distribution of anti-Zapata RT’s, the users were classified according their activity (the classification details below, at methodology) and found that the speakers, 508 users, received 52,415 RT’s, so 2.65 % of users obtained 79,99% of RT’s against Zapata.
The following interactive graphic show the classification of anti-Zapata users based on the impact of their tweets. Clicking on each users group can see at the bottom the users ordered by the number of RT’s received.
Likewise we can see in the following interactive graphic the RT activity of anti-Zapata users. We found 2,830 users that retweeted 37,641messages, so 14.74% of users retweeted 57.44% of messages.
The hard core of those who moved tweets was about 3.500 users. We can conclude that there was more bark than bite.
The role of the speakers and the media
To see how the speakers and the media influenced the spread we have created three graphics temporarily aligned. The first one is the time evolution of total tweets, anti-Zapata and pro-zapata. The second shows the distribution of the twenty most widespread tweets, both anti-and pro-Zapata Zapata (used a colour code to group. Anti-Zapata blue, purple pro-Zapata and green neutral. Mouse over the graphic displays text of the tweet and see the number of RT’s that had at that time). The third graph shows the spread of the tweets of the media and journalists.
During the 13th June the pattern of diffusion of second and third graphs was similar because pedroj_ramirez and isanseba messages were almost all in the top 20 and there weren’t other journalists publishing tweets. On day 14th June, the propagation of journalists users lost weight against other influential users.
We could conclude that pedroj_ramirez and isanseba messages helped to create TT on 13th but on the 14th other users intervened.
Pro or contra Zapata?
The polarization of users is reflected in this RT’s graph. On the left, in a single community, they are those who supported Zapata and right attacked him, formed by several groups sympathetic to the Jewish community and people of liberal-conservative ideology.
(Click on image for a larger view)
Methodology
- The data was obtained with the Twitter REST API, search method, applying the tweets containing the hashtag «#ZapataDimision OR # dimisióndeZapataySoto»
- 130,954 tweets from 37,979 different Twitter users were captured from 06/13/2015 to 6/15/2015 14:39:09 17:17:37
- To determine the polarity of tweets semantic analysis has not been used (I’m not an expert in this technology) instead we used RT relation. Users tend to RT messages with which they agree, this causes some users to be more interrelated than others and those communities are formed. The polarity was obtained from the graph of RT’s using Gephi. Several communities were detected whose users were classified as: anti-Zapata (19,205 users), pro-Zapata (13,782 users) and uncertain that retweet different polarity (1,378 users)
- Once users were identified as anti or pro Zapata, their tweets were segregated in order to analyse them separately. 80 867 tweets were classified as anti-zapata (61,75%),. 43.193 tweets as pro-Zapata (32.98%) and 5.26% were uncertain or not retweeted. The accuracy of this classification was measured checked manually a random sample of 300 tweets in each of the datasets. For anti-Zapata tweets precision was 94.33% and for the pro-Zapata 92%
- Anti-Zapata users were classified according to their activity and impact in these categories
- Speaker: When the number of RT’s received was four times greater than the volume of tweets published. There were three groups: the high speaker formed by users with more impact than accounted for 20% of RT’s, medium speakers are the next most retweeted users who obtained 30% of RT’s and other ones were low speakers
- Networker: high activity, a number of RT’s received above average, and the number of RT’s sent and received was balanced
- Retweeter: with high activity and more RT’s that own tweets
- Replier: most of his tweets are replies. As replies do not appear on the timeline usually don’t receive RT’s
- Monologist: activity above average and the number of RT’s received low
- Normal: other users who do not follow these specific behaviour patterns
- The spread of the 20 most widespread tweets and tweets of the media and journalists analysed to see how the overall expansion favoured
- The graph display RT’s was performed with Gephi
1 respuesta
[…] anterior post que titulé “El hashtag #zapatadimisión en 360º” se analizó la difusión vía RT del hashtag #zapatadimisión. Para comprender mejor los […]